Today, the Washington Post published a piece by data journalist Philip Bump that sought to look at how changes in Trump’s approval rating relate to changes in the generic ballot. If Trump gets more popular, does that correlate with a stronger performance by the GOP on the generic ballot? As he is rated more unfavorably, are polling respondents less likely to indicate that they’ll vote for the GOP in November?
To address this question, Bump creates a funny set of plots (he describes as ‘unnecessarily-complicated’) that show how, during a particular month, Trump’s net approval rating (approval – disapproval) and the GOP’s advantage on the generic ballot (% who support the GOP – % that support the Democrats) both change. The result are these odd squiggle plots that show, for each day in a month, where net approval and net GOP advantage were. You can think of these like a top-down view of a footprints left in snow by an animal wandering through a landscape, so its path is allowed to cross over itself (I won’t bother trying to map this analogy completely onto the polling data).
Wait – RCP data?
As you might know from the polling market guides, there are some idiosyncrasies with how RCP maintains their polling averages.
RCP –
- Only uses polling data from a select few pollsters
- Has no strict/explicit policy about the date ranges of polls that contribute to its average at any given point in time
- Has no strict/explicit policy about how many polls contribute to its average at any given point in time
- As a result, will arbitrarily “drop” polls from its average for no explicitly discernible reason
So what if we do Bump’s analysis with 538 data?
On a lark I decided to replicate his analysis with 538’s data (538’s average is methodologically much more rigorous). All polls are included by 538, and the number of polls and how they contribute to the average is determined purely by algorithm with no contribution of human whim.
As I suspected, the results are a bit different. For instance, here’s January 2018:
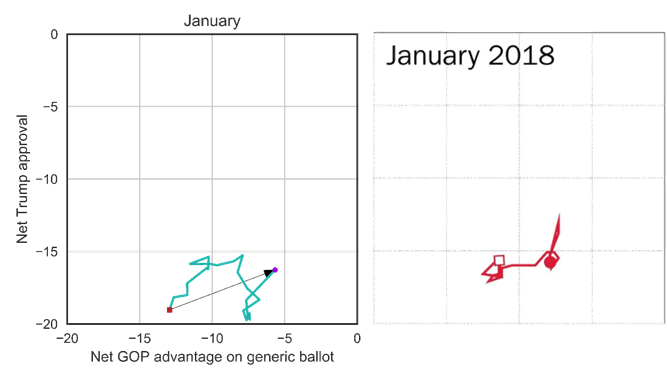
(I also added an arrow that shows the path from the start of the month to the end of the month; Bump’s presentation has an open square representing the start and a closed circle representing the end).
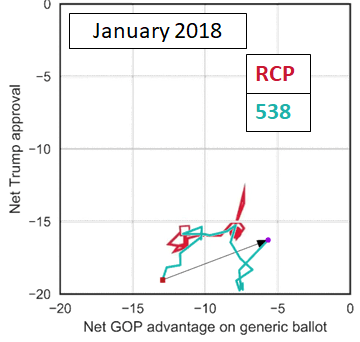
538 and RCP are pretty different
I don’t have the RCP numbers to do the actual math, but you can see by comparing the monthly graphs from the 538 data to the RCP data that things are often dissimilar. Bump’s RCP data is here, the 538 plots are below:
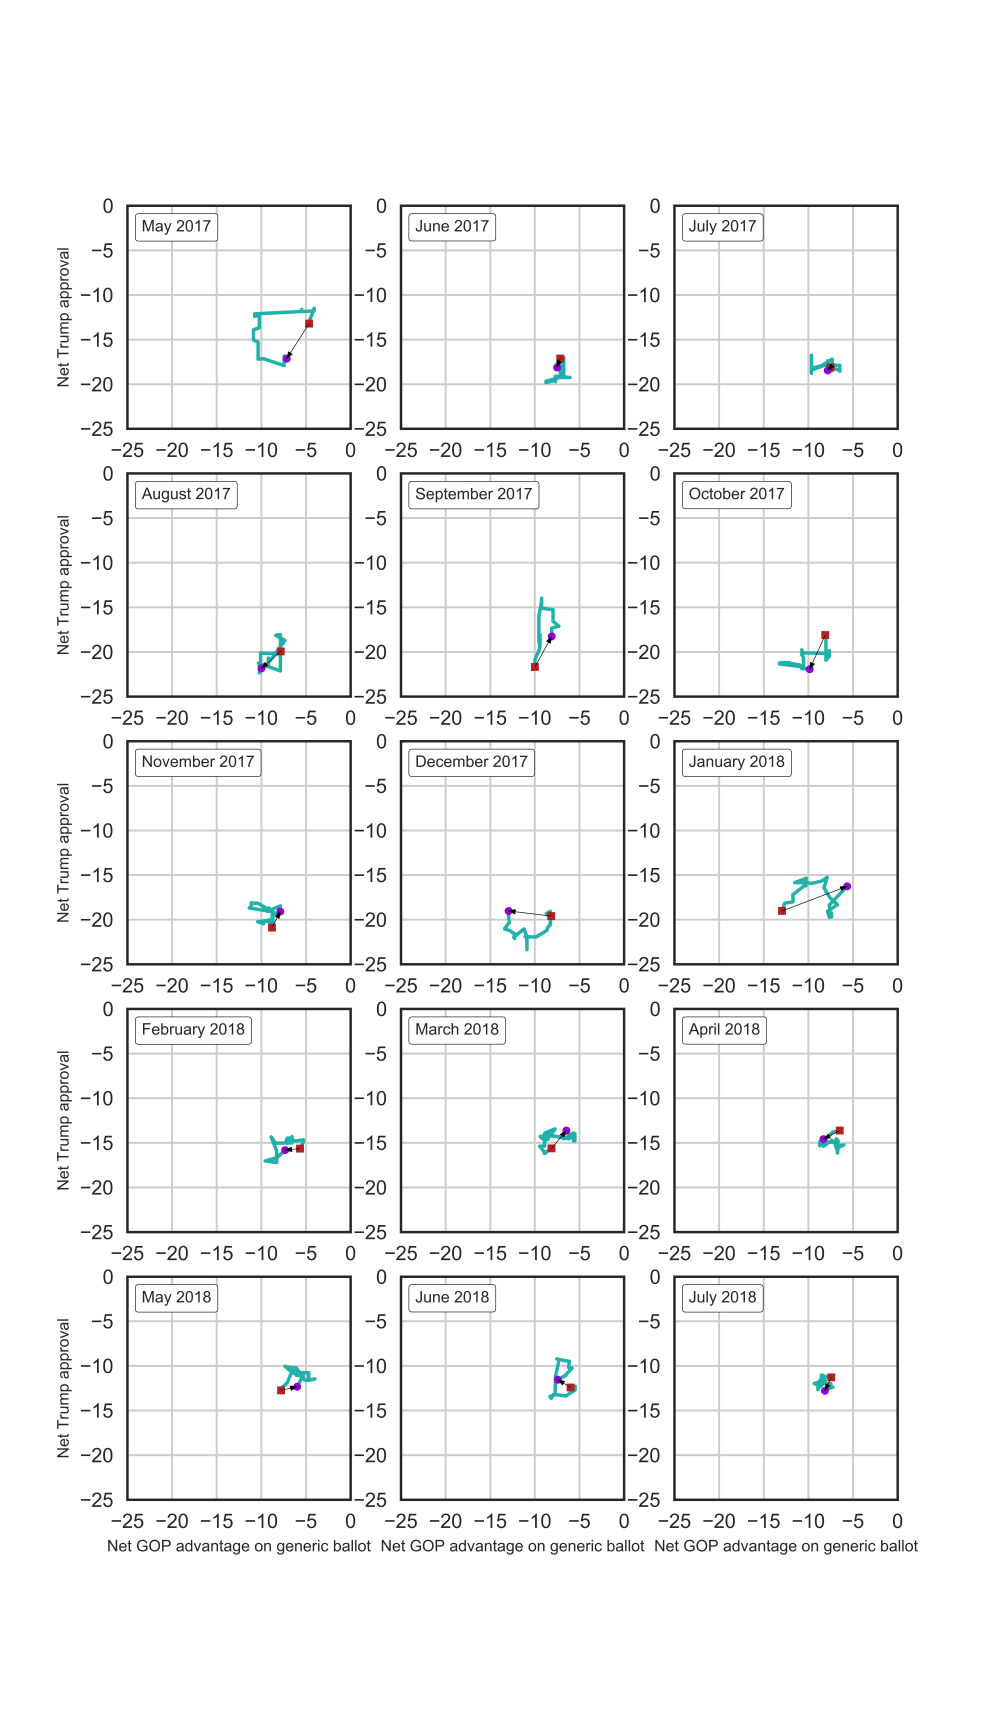
But the main picture is still the same
The whole purpose of the analysis is just to show how Trump’s approval rating relates to the GOP (dis)advantage on the generic ballot. Bump writes:
“Notice the general patterns here, though. Up-and-down and left-to-right line movement in a month; often, diagonal movement from lower-left to upper-right or vice versa. But not much movement from upper-left to lower-right — not much movement in which Trump’s numbers were headed one way and his party’s another.”
This is also true in the 538 data, but I think the point is made a little more obvious if you simply consider the full dataset all at once rather than digesting each month piecemeal:
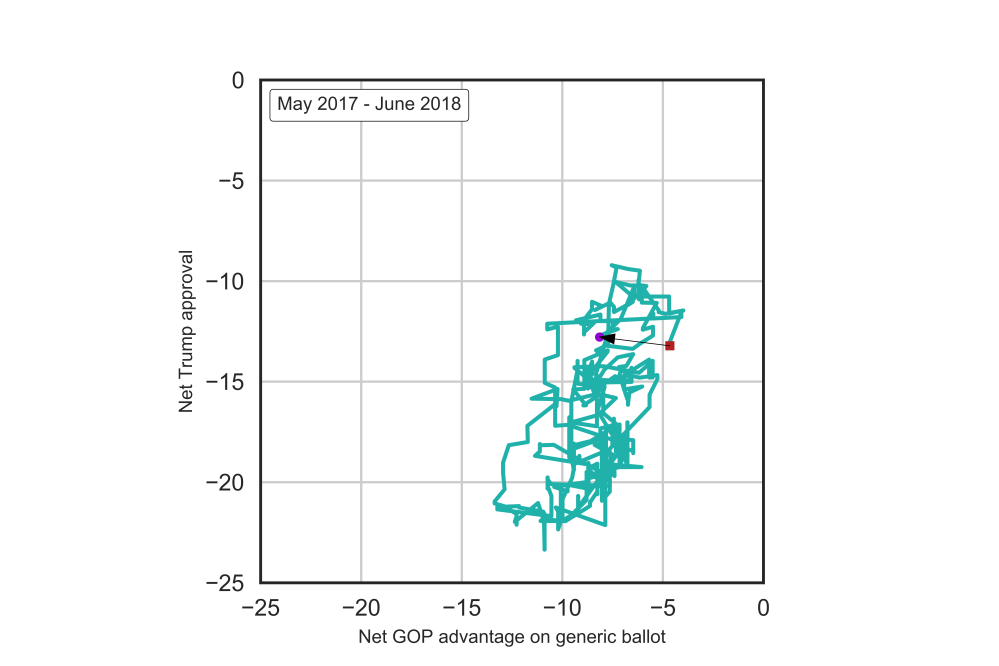
Here you can see that there’s a linear relationship between Trump’s net approval and GOP net advantage on the generic ballot. But it’s not 1:1 – that is, Trump’s net approval has to move fairly substantially in order to alter the GOP’s standing. (While Trump’s net approval has varied across a roughly 15 point range, the GOP’s position has only varied across a 10-point range.)
This point is underscored by the direction of the arrows in the next plot, which just show each month’s change in the dataset:
One more caveat
It’s worth pointing out that both 538 and RCP maintain averages for Trump approval and the generic congressional ballot that each contain different polls. This is because some polls and some pollsters might poll Trump approval and not ballot (or, less commonly, the other way around). So we’re not exactly comparing the aggregate responses of the same people here. Nonetheless, I suspect the results would be the same if you filtered the averages to only polls that asked both questions.
