Keeping track of all the markets in play this November is challenging. PredictIt’s interface isn’t always ideal and many markets can slip through the cracks. To help you find the markets you’re interested in, I’ve organized everything relevant to the midterm elections into a single spreadsheet:
https://docs.google.com/spreadsheets/d/1AEiZdS_yGvwIJhE4s8sn9pIISkdxmzaJEzhzI104Kow/edit?usp=sharing
Find markets and compare their prices to what other forecasters and models say
I’ve included data from several other modelers/forecasters for you to gauge what the chances are in a given race (whether or not we have a market). In this way you can see where there’s consensus and disagreement among modelers or between modelers and the market.
Organization and update schedule
There are four sheets in the spreadsheet:
- Major markets – the high volume markets that cover the overall outcome of the 2018 midterms
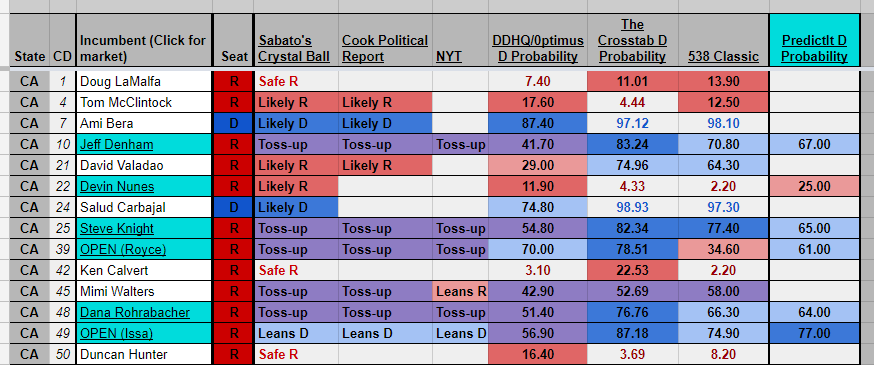
- House – forecasts for each individual House race (only “competitive” races are shown)
- Senate – forecasts for each Senate race
- Governors – forecasts for each governor’s office race
I plan to update this spreadsheet once a week – partly because it’s currently very time-consuming to get data for DDHQ and 538 for individual races. While I’ll work on automating that, for now expect only a weekly update. But in the interim, you can feel free to use the spreadsheet as a springboard to visit those sites whenever you feel to see the most recent version of their model’s output.
Models disagree!
Each modeler and forecaster works with different assumptions, algorithms, and even data. Different inputs, different machines. So they should be expected to produce different results from each other, especially at the individual House district level. Below I’ve highlighted a few examples of interesting divergences.
What’s going on in CA-39?
This open race for Ed Royce’s seat is rated a toss-up by the experts, a lean D to likely D by DDHQ and The Crosstab, an a Lean R by 538. PredictIt thinks it slightly favors the Democrats.
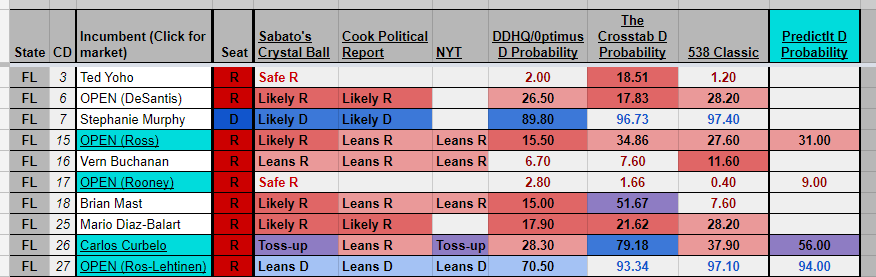
Is Curbelo in trouble or winning in FL-26?
While I haven’t systematically measured divergence (not sure that it would be very informative), by eye this is the race the modelers and experts disagree about the most. (The rest of Florida is estimated with relative consensus).
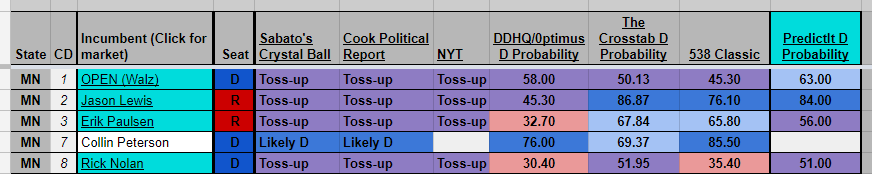
Models agree MN races are ¯\_(ツ)_/¯
Consensus and disagreement both indicate that these races are tight. Will be interesting to see (now that primaries are over) how new polling starts to tease this apart.
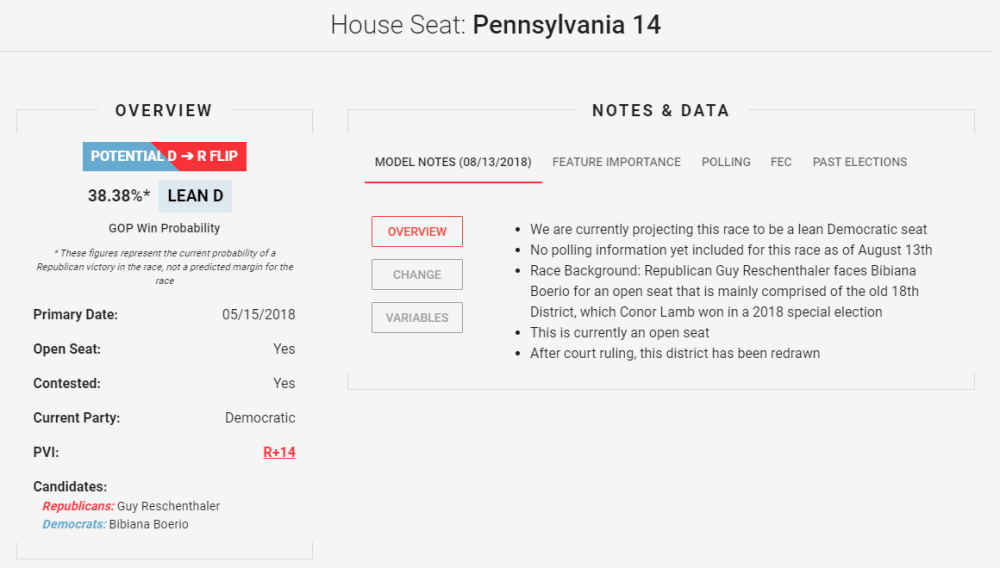
Weirdness in OH and PA
While there are some out-there predictions all over, a few stick out in these states. How can TheCrosstab’s model favor Republicans at >99% in OH-12? How can DDHQ/0ptimus’s model think Democrats are 60-40 favorites in PA-14?

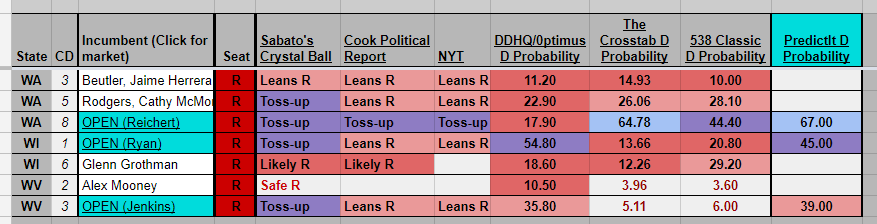
Wild disagreements in WA, WI, and WV
Not sure what to make of these WA-08, WI-01, and WV-03 forecasts.
The rest
There’s plenty more little nuggets in there (if nothing else, I found a few potentially mispriced markets along the way). Check out Nunes, for instance. And did you know PI made a market for NY-09 for some reason?
If you have any suggestions for additional data I should incorporate don’t hesitate to send them my way (@jipkin, on the PI boards, or here). Otherwise, hope you find this useful, and enjoy!
